Our Comprehensive Services
Discover how Kiln Web App Data Development Studio can transform your data into powerful, interactive visualizations and custom web applications tailored to your specific needs.
Explore Our Expertise
From cutting-edge web data visualization development to sophisticated web dashboard design, our team is ready to bring your data to life. Browse through our service offerings below to find the perfect solution for your project.
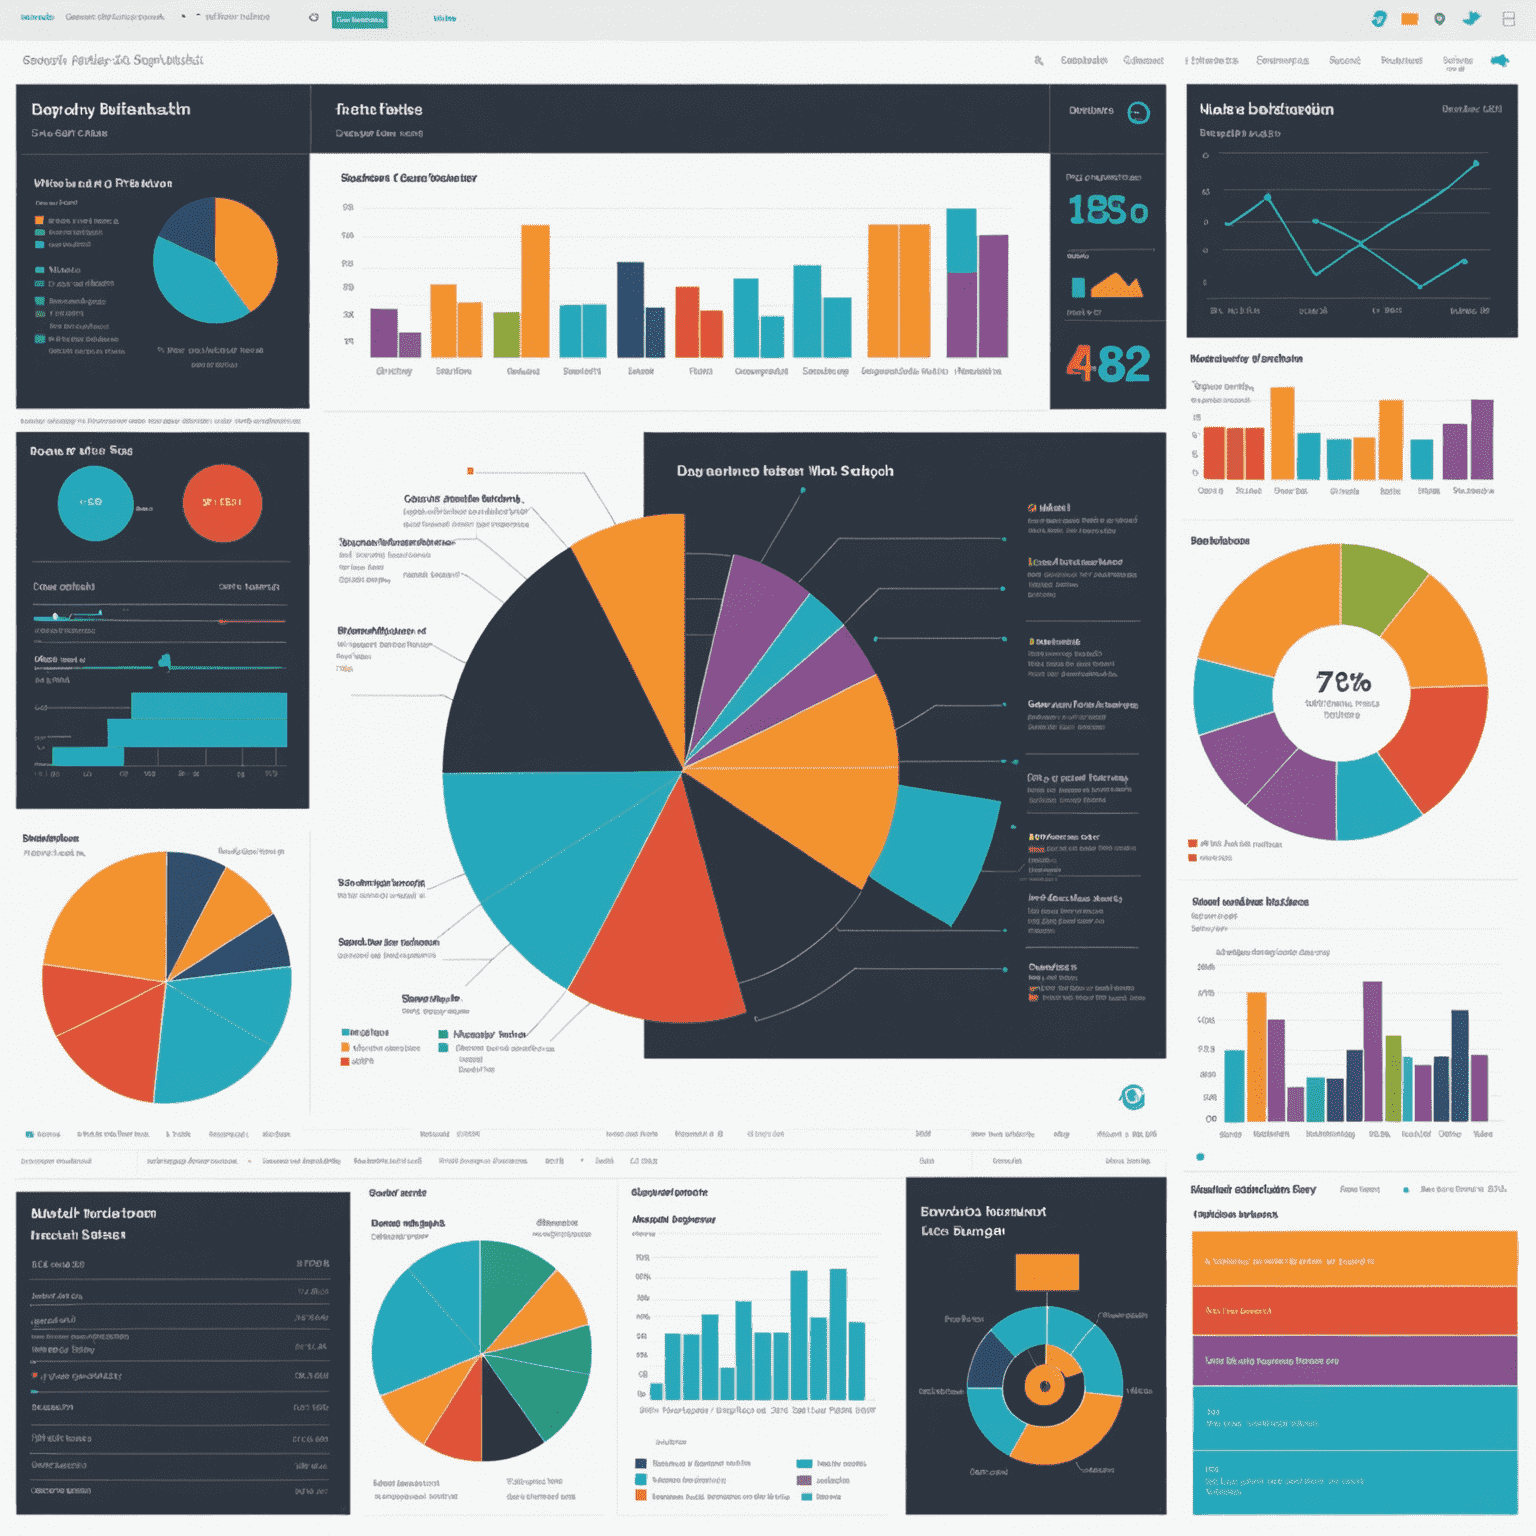
Data Visualization Services
Explore our cutting-edge data visualization services, transforming complex datasets into clear, interactive visual representations for enhanced decision-making.
Learn More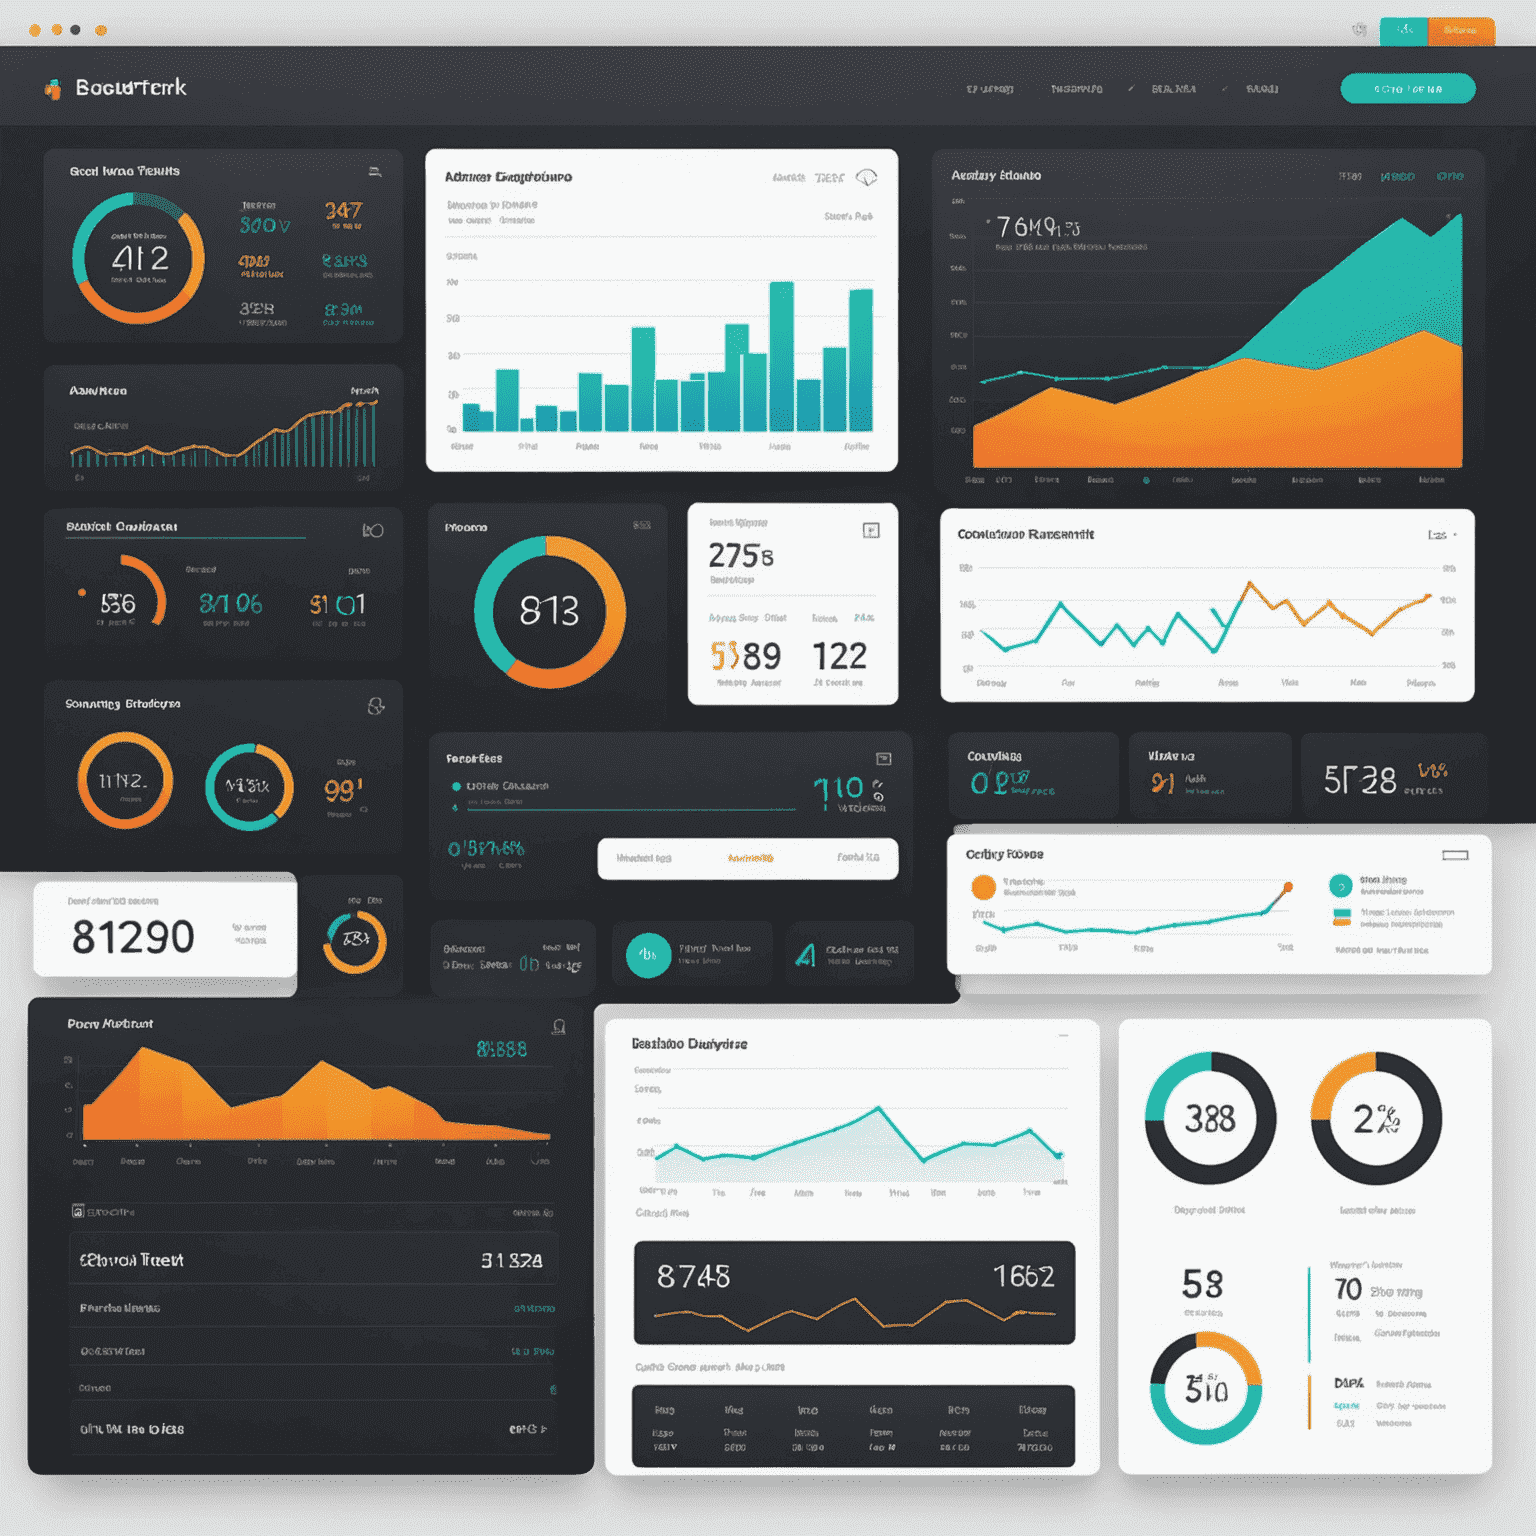
Custom Dashboard Design
Learn about our bespoke dashboard design services, tailoring intuitive interfaces to meet your specific business needs and data requirements.
Learn More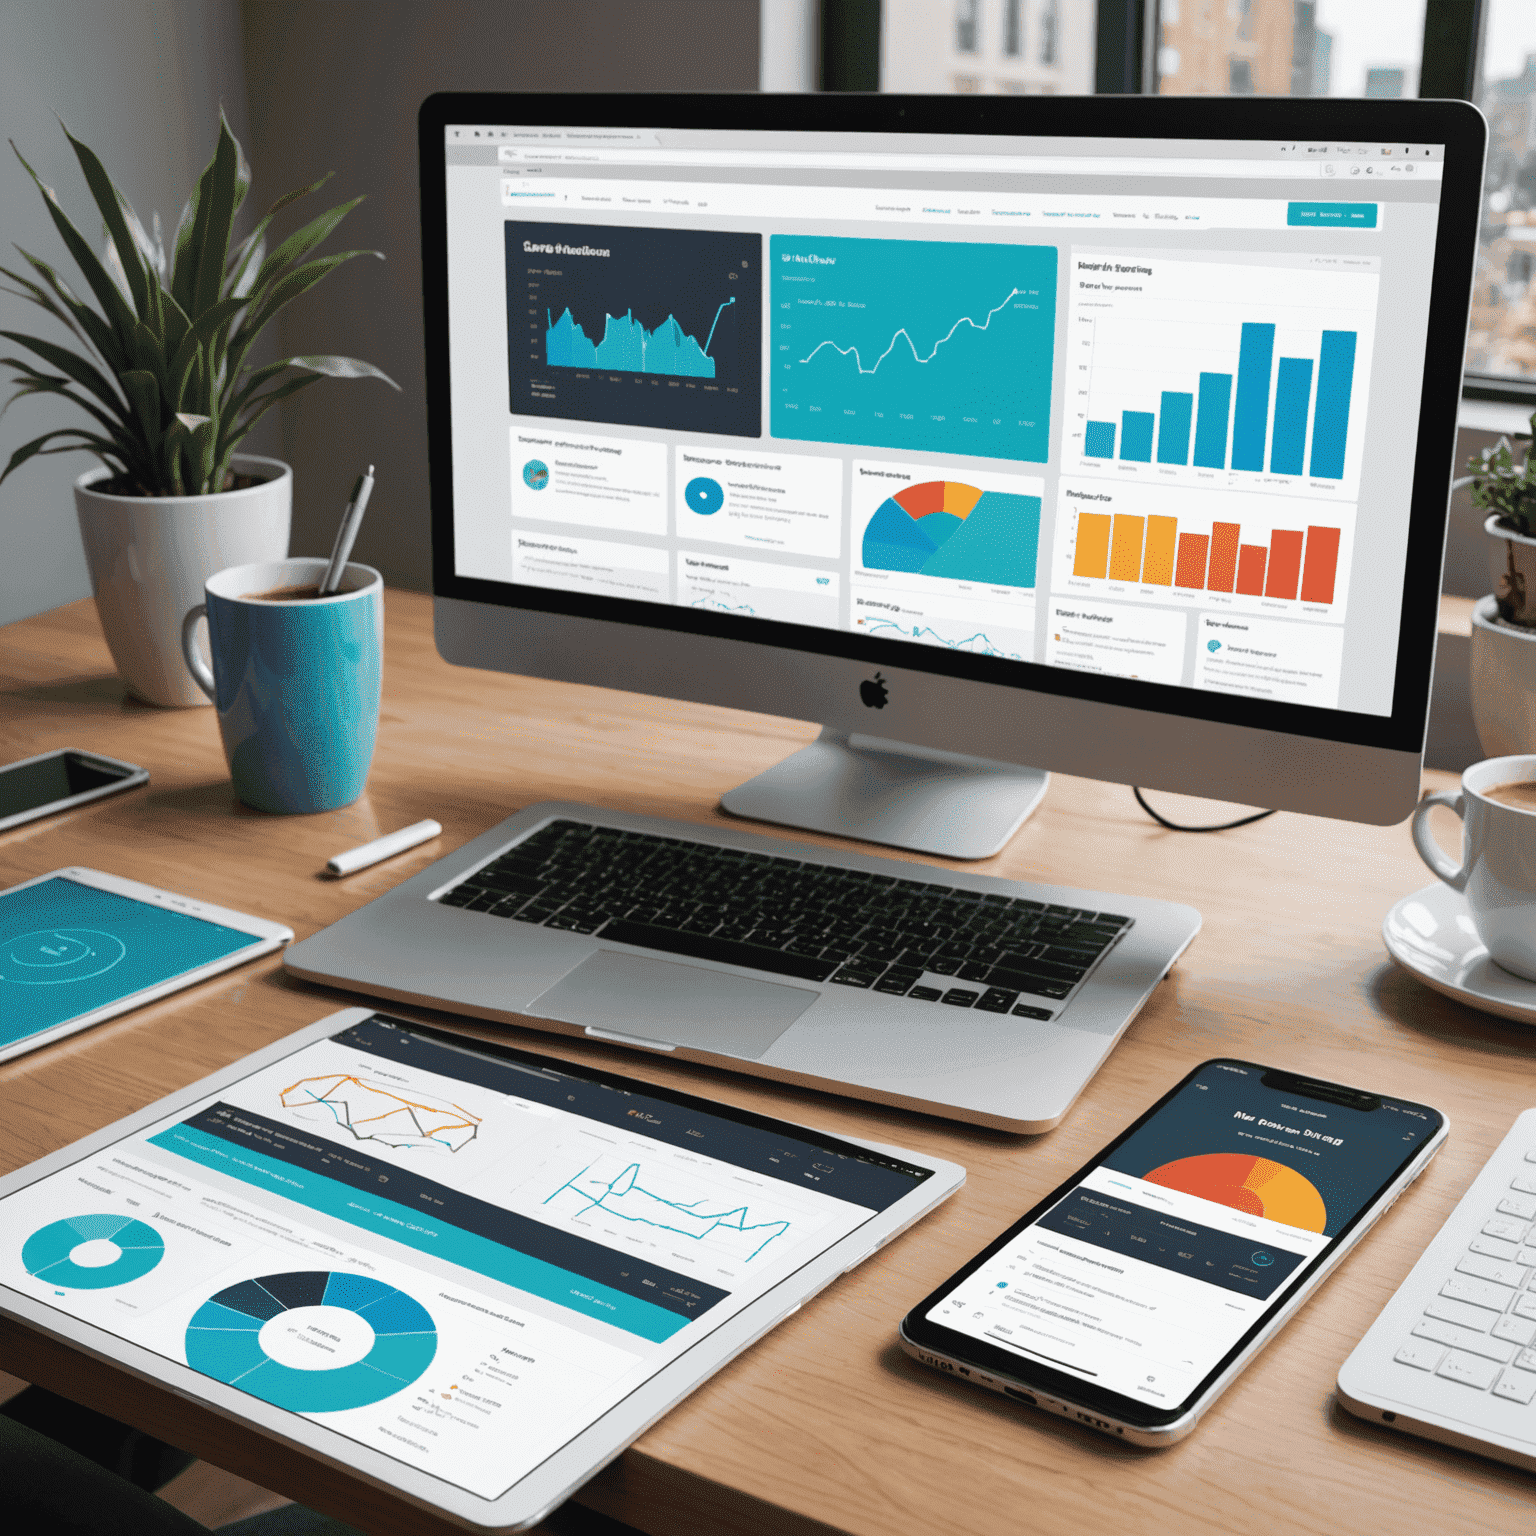
Web App Development
Discover our expertise in creating robust, scalable web applications that seamlessly integrate data visualization and interactive features.
Learn More
Data Integration Solutions
Find out how we can help you connect and harmonize data from multiple sources, enabling comprehensive analysis and visualization.
Learn More
Training and Support
Learn about our training programs and ongoing support services, ensuring you maximize the potential of your data visualization tools and dashboards.
Learn More